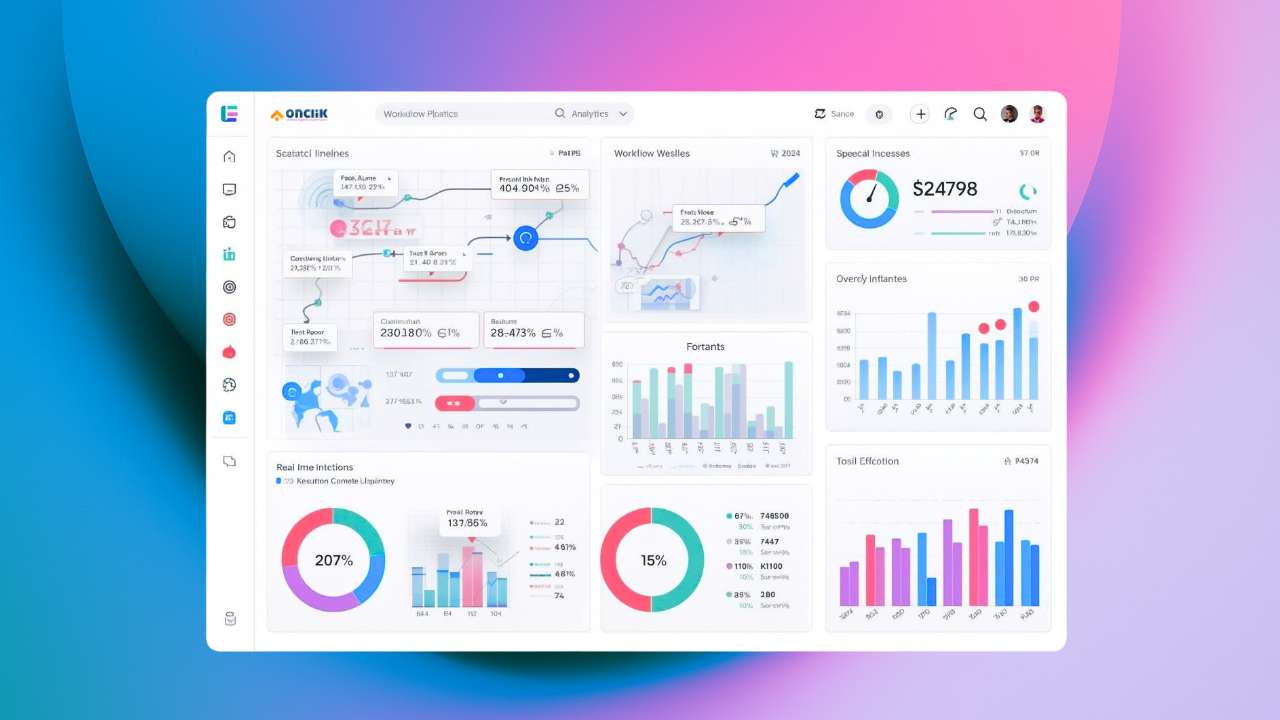
Interactive Dashboards
Live performance views with the ability to drill down into specific workflows, spot trends, and track the KPIs that matter most to your team.
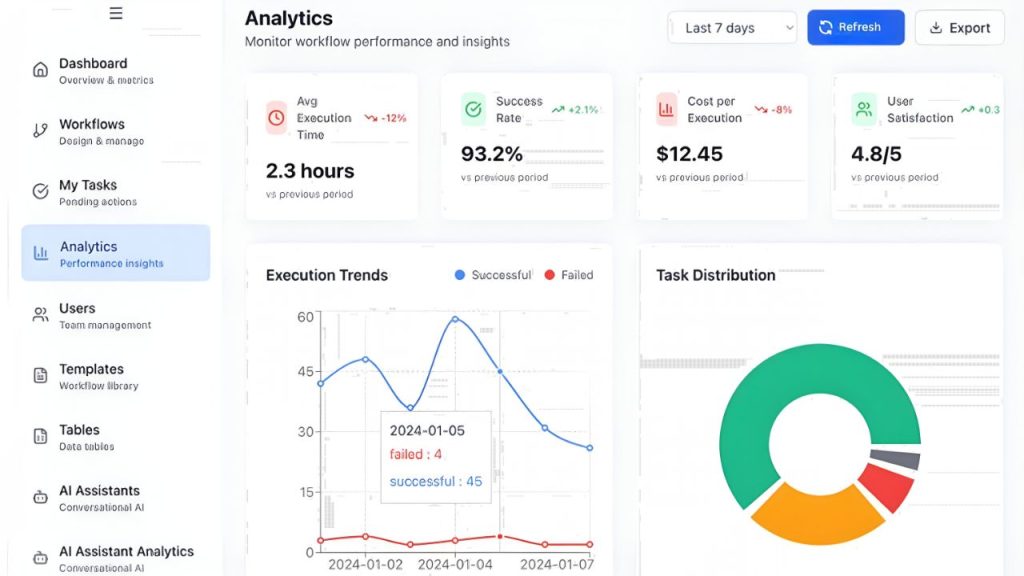
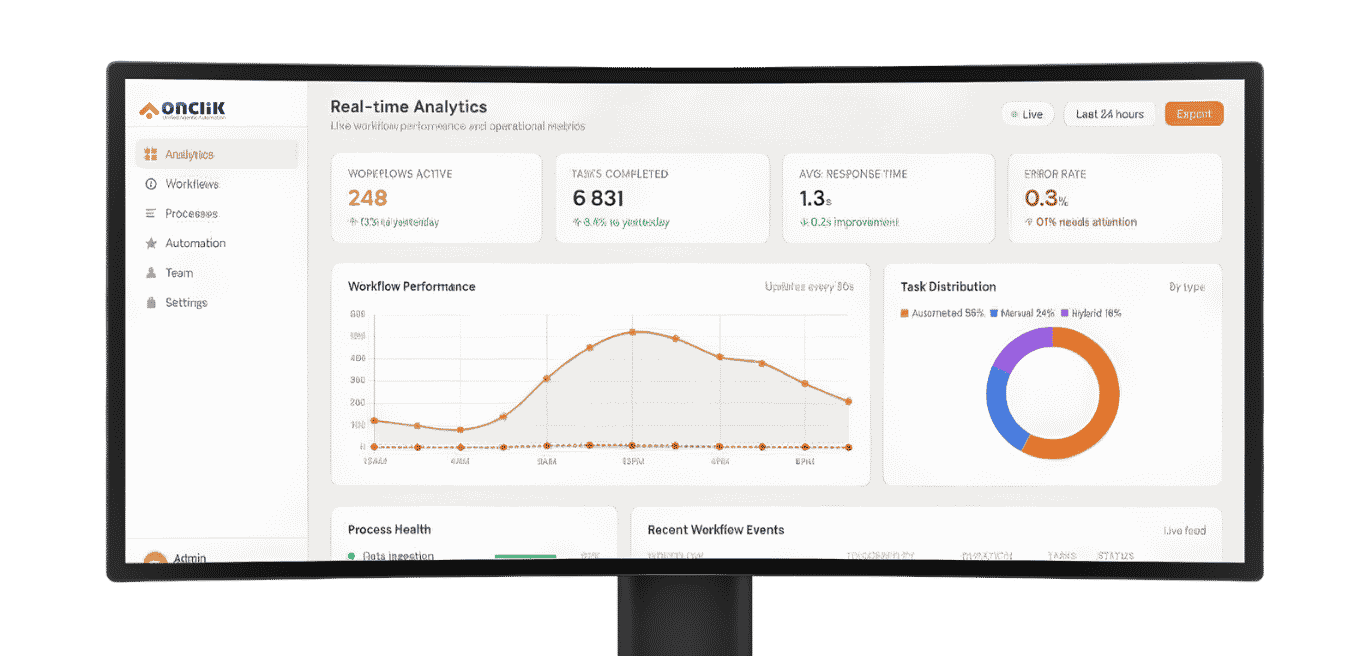
Workflow Performance Tracking
Continuously measure execution speed, success rates, processing volume, and error frequency across all your automated business processes.
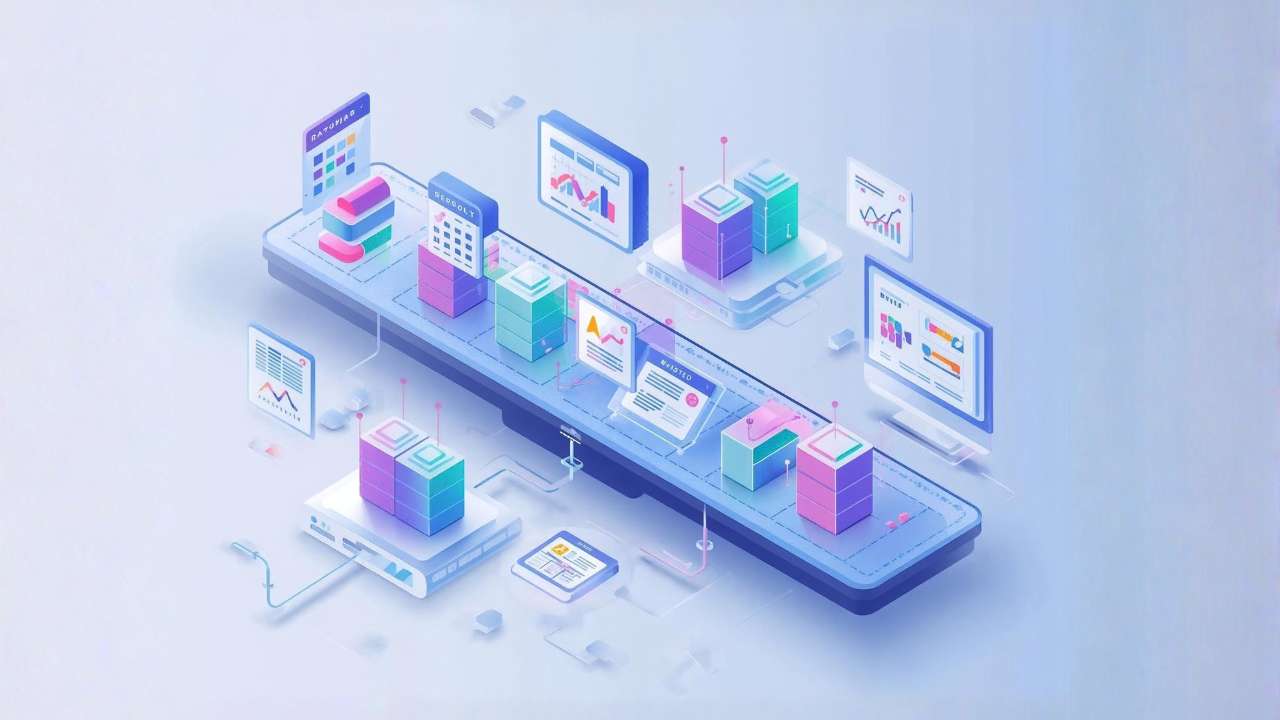
Automated Reporting
Schedule reports to be generated and sent automatically to the right stakeholders, at the right time, in the format they prefer.
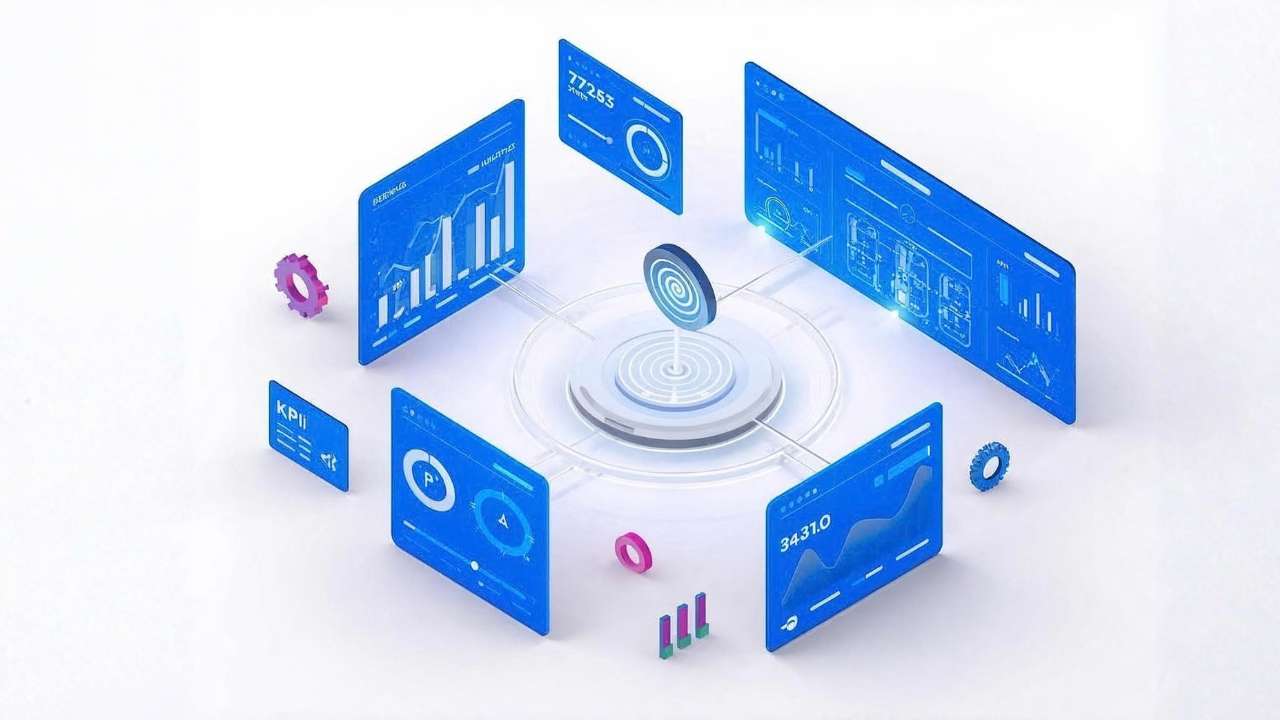
Customizable Metrics
Define the metrics that align with your business goals. Set performance benchmarks, create composite scores, and configure alerts for any threshold.

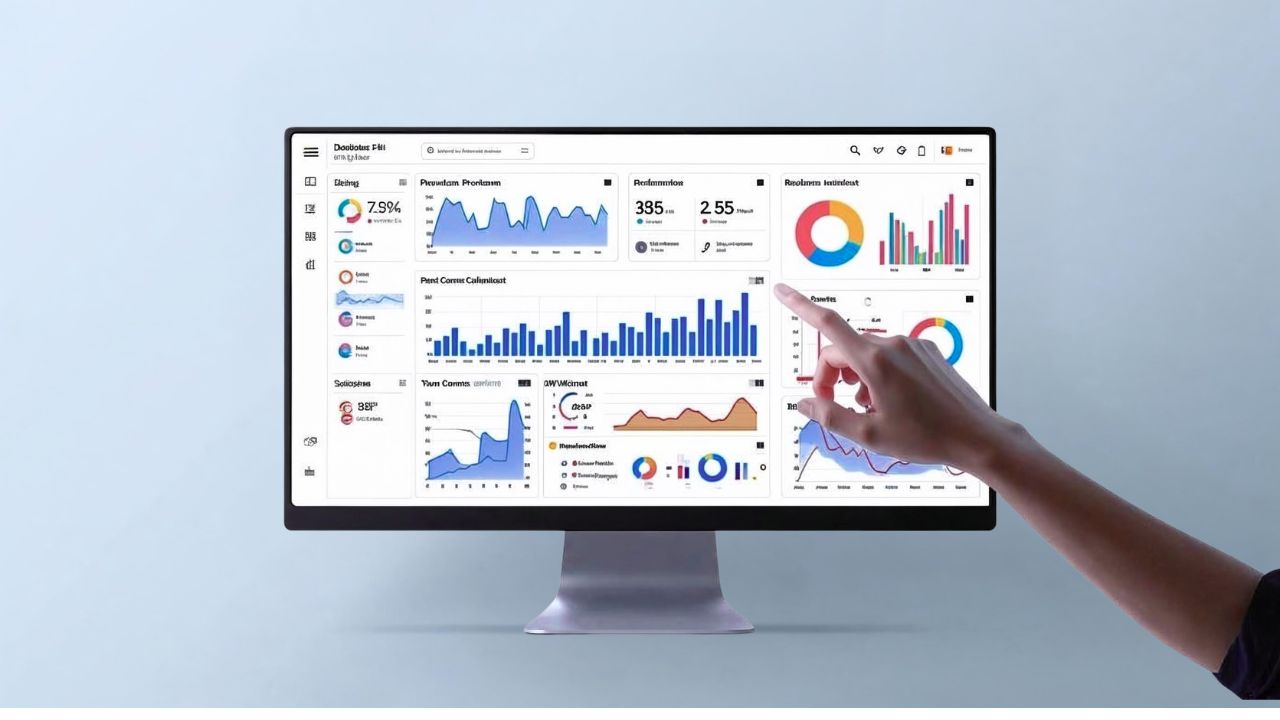
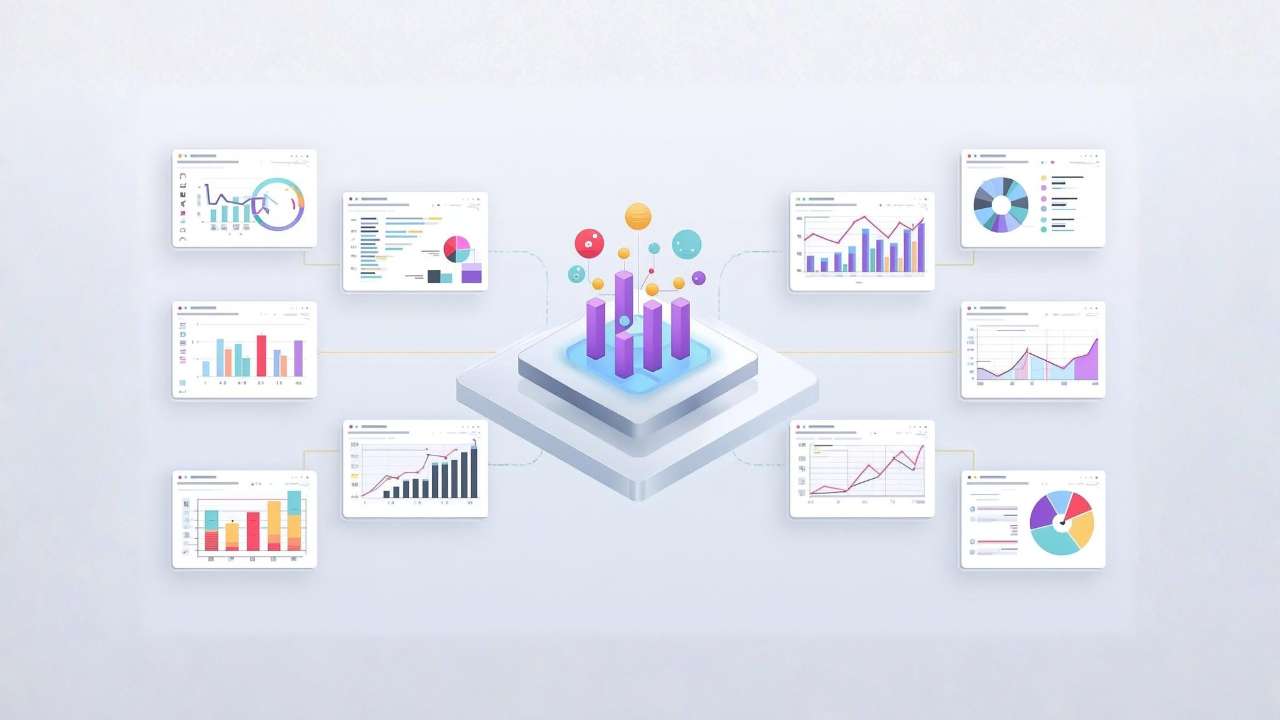
Data Visualization
Converts large volumes of raw process data into easy-to-read charts, trend graphs, and performance heatmaps that anyone on your team can understand.
Cross-System Data Analysis
Pull analytics from your ERP, CRM, legacy applications, and cloud platforms into a single unified view, with no manual data stitching required.